
“You don’t get paid for what’s already happened. You only get paid for what’s going to happen in the future.
The past is only useful to you in the extent to which it gives you insights into the future, and sometimes the past doesn’t give you any insights into the future.” Warren Buffett
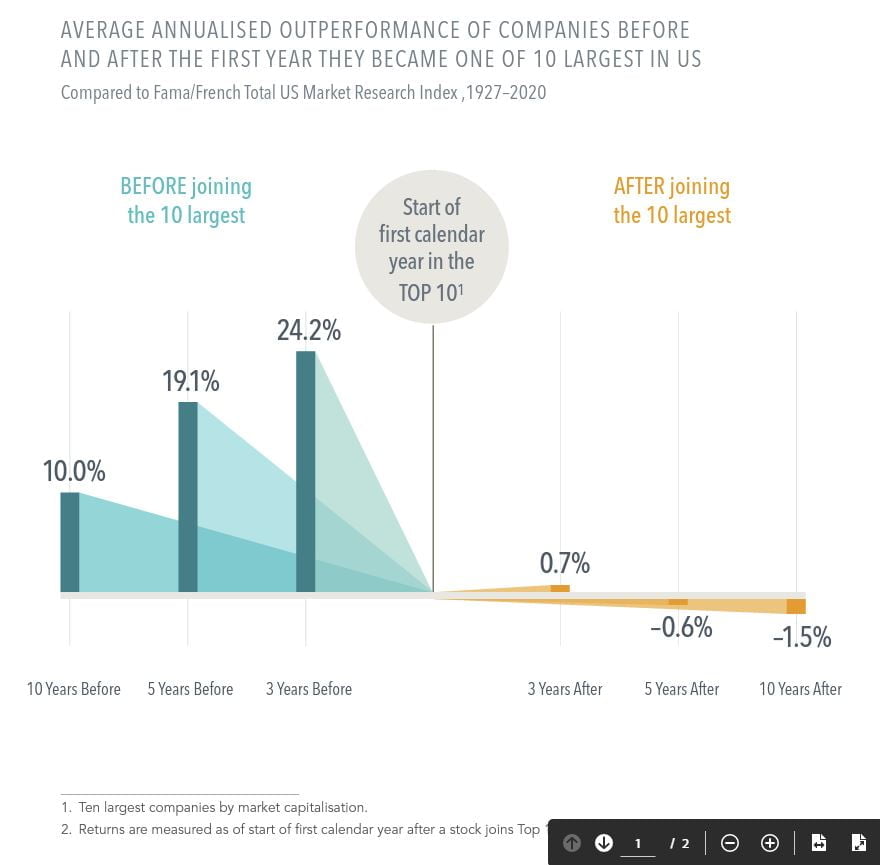
As companies grow to become some of the largest firms trading on the US stock market, the returns that push them there can be impressive. But not long after joining the Top 10 largest by market cap, these stocks, on average, lagged the market.
- From 1927 to 2020, the average annualised return for these stocks over the three years prior to joining the Top 10 was nearly 25% higher than the market. In the three years after, the edge was less than 1%.2
- Five years after joining the Top 10, these stocks were, on average, underperforming the market — a stark turnaround from their earlier advantage. The gap was even wider 10 years out.
- Intel is an illustrative example. The technology giant posted average annualised excess returns of 29% in the 10 years before the year it ascended to the Top 10 but, in the next decade, underperformed the broad market by nearly 6% per year. Similarly, the annualised excess return of Google five years before it hit the Top 10 dropped by about half in the five years after it joined the list.
Expectations about a firm’s prospects are reflected in its current stock price.
Positive news might lead to additional price appreciation, but those unexpected changes are not predictable.
DISCLOSURES
Past performance is no guarantee of future results. Indices are not available for direct investment; therefore, their performance does not reflect the expenses associated with the management of an actual portfolio. This information is intended for educational purposes and should not be considered a recommendation to buy or sell a particular security. Named securities may be held in accounts managed by Dimensional.
In USD. Source: Dimensional, using data from CRSP. Includes all US common stocks excluding REITs. Largest stocks identified at the end of each calendar year by sorting eligible US stocks on market capitalisation.
Market is represented by the Fama/French Total US Market Research Index. Annualised Excess Return is the difference in annualised compound returns between the stock and the market over the 3-, 5-, and 10-year periods, before and after each stocks’ initial year end classification in the top 10. 3-, 5-, and 10-annualised returns are computed for companies with return data available for the entire 3-, 5-, and 10-year periods respectively.
The number of firms included in measuring excess returns prior (subsequent) to becoming a top 10 stock consists of 39 (54) for 3-year, 38 (53) for 5-year, and 30 (47) for 10-year.
Fama/French Total US Market Research Index: The value-weighed US market index is constructed every month, using all issues listed on the NYSE, AMEX, or Nasdaq with available outstanding shares and valid prices for that month and the month before. Exclusions: American Depositary Receipts. Sources: CRSP for value-weighted US market return. Rebalancing: Monthly. Dividends: Reinvested in the paying company until the portfolio is rebalanced. Eugene Fama and Ken French are members of the Board of Directors of the general partner of, and provide consulting services to, Dimensional Fund Advisors LP.
AUSTRALIA and NEW ZEALAND: This material is issued by DFA Australia Limited (AFS License No. 238093, ABN 46 065 937 671). This material is provided for information only. No account has been taken of the objectives, financial situation or needs of any particular person. Accordingly, to the extent this material constitutes general financial product advice, investors should, before acting on the advice, consider the appropriateness of the advice, having regard to the investor’s objectives, financial situation and needs. Any opinions expressed in this material reflect our judgement at the date of publication and are subject to change.