
[nectar_dropcap color=”#0071bc”]O[/nectar_dropcap]f all the set-piece news events regularly covered by the media, none generates as much noise as a federal election. With voters due to go the polls in Australia on 21 May, how much attention should you pay as an investor?
Of course, we can all have different political views as individual citizens. Reasonable people obviously can disagree about what the key issues should be and how they should be treated. But as investors, a more dispassionate view is required.
This is not necessarily because financial markets don’t take elections into account. But the truth is that elections are just one of many factors that drive prices of securities. And it is very hard to separate any one of those myriad factors from the others.
In 2022, for instance, the most talked-about news events in global financial markets have been Russia’s invasion of Ukraine, rising measures of consumer price inflation and the removal of pandemic-era emergency policy stimulus by central banks.
In comparison, the Australian election has not been a major market focus, particularly when you consider the local market makes up only about 2% of the global market and when little separates the two major parties on macro-economic policy.
Of course, it is in the interests of politicians of either side to claim they ‘manage’ the economy and to talk up the dire consequences of what would happen if their opponents took power. But markets to date have not been showing any disquiet either way.
Actually, there is very little evidence from history either that election wins from one major party or the other has a definitive impact on the local share market, separate from all the other things that are going on at the time of the election.
The chart below shows the frequency of monthly returns of a broad-based Australian equity benchmark in the months when Australia elections were held over the past 50 years, going back to the election of the Whitlam government in 1972.
The red marks represent months the Australian Labor Party won. The blue marks represent months the Liberal-National Coalition won. The grey marks represent nonelection months over this half-century period.
Exhibit 1: Distribution of Monthly Returns for MSCI Australia index January 1970 – April 2022
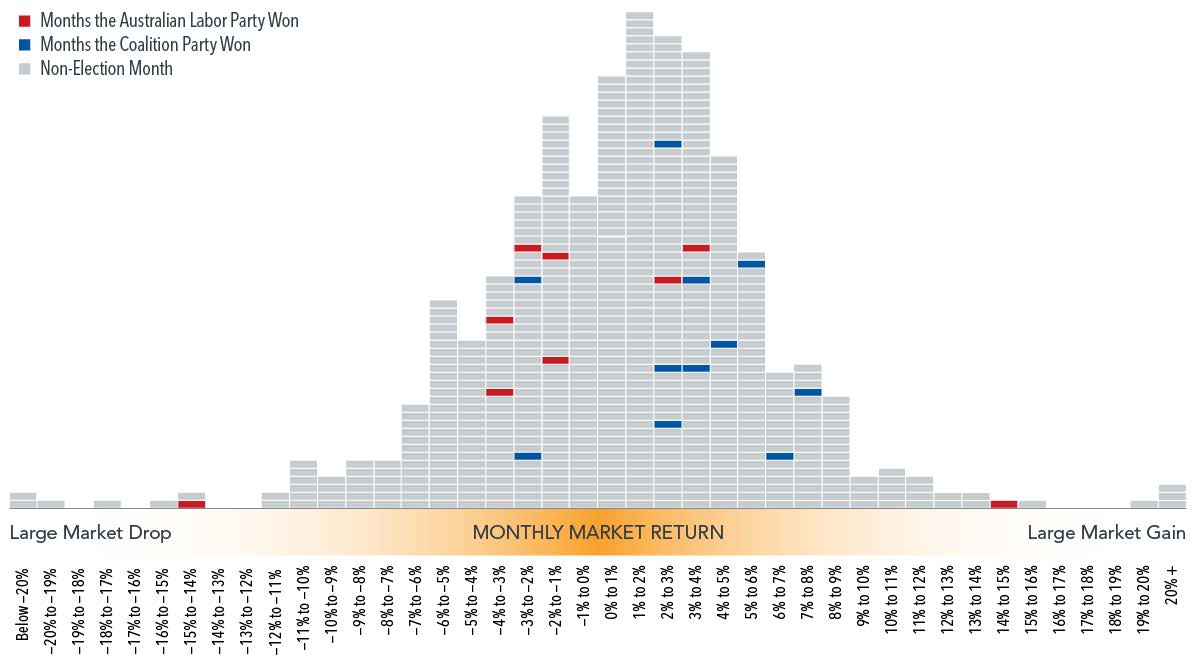 In Australian dollars. Indices are not available for direct investment. Their performance does not reflect the expenses associated with the management of an actual portfolio. Dashes representing returns of a given month are stacked in ascending order of return within each column, with highest return within that range on top.
In this time, there were 19 Australian federal elections, of which 10 were won by the Coalition and nine by Labor. Similar to the analysis that Dimensional did of US presidential elections, the chart shows election month returns have been well dispersed throughout the range of outcomes, with no clear pattern based on which party won.
For instance, the single worst result in this sample was the election held in May 1974, won by Labor under Gough Whitlam and a month in which the local share market fell more than 14%. But then the single best result was also an election won by Labor under Bob Hawke in July 1987, when the market rose by more than 14%.
Of course, other things were also happening in both those years. From 1973-74, for instance, global equity markets were suffering one of their worst downturns following the collapse of the Bretton Woods system of fixed currencies and a global oil shock.
In 1987, global share markets were coming to the end of a five-year bull run that ended in October that year with the so-called Black Monday crash.
The point is that at any one time, there is news coming from many different directions – from company earnings to economic data to geopolitical events to policy and regulatory changes. Markets are like giant information processing machines that build all this news, good and bad, into prices.
It is natural for investors to look for a connection between who wins power in Canberra and which way stocks will go. But shareholders are investing in a company, not a political party. And companies focus on serving their customers and helping their businesses grow, regardless of who is in government.
What this means is that making investment decisions based on the predictions of election outcomes or actual outcomes is unlikely to result in reliable excess returns. On the contrary, it may lead to costly mistakes.
Ultimately, this adds up to a strong case for relying on a consistent approach to your asset allocation—making a long-term plan and sticking to it.
This article was written by Jim Parker, Vice President of Dimensional, and published in the Dimensional website on May 16, 2022. The author, Jim Parker, Vice President of Dimensional, thanks Senior Researcher Warwick Schneller for his assistance with this article.
If you would like to chat about how this impacts your financial goals please call me on 5331 6550 or email andrew@arwm.com.au
Cheers, Andrew