
Investment opportunities exist all around the globe. Across more than 40 countries, there are over 15,000 publicly traded companies.1 If you listen to the news, however, some countries may seem like better places to invest than others based on how their economies and stock markets are doing at the time. Fluctuations in performance from year to year only add to the complexity, providing little useful information about future returns.
Daunted by the prospects of sorting it out, some investors look to the place they know best—their home market. There can be good reasons, such as tax benefits, for prioritising an investment close to home, but too much home bias could mean underweighting or missing out on part of the investment universe.
Australia, for example, represents 2% of the global equity market. An Australian who aims to build a global equity portfolio may have cause for investing a greater amount at home. However, this would come with the tradeoff of reduced investment in other countries. The same is true for a Japanese investor, whose home country represents 8% of the global equity market. Even the US equity market—the world’s largest by far—is only about half of the global opportunity set.
Fortunately, no one needs to be an expert in every region to benefit from the opportunities those regions present. Equity markets process information continuously, leveraging knowledge from millions of buyers and sellers each day as they set security prices. Investors can trust market prices to provide an up-to-the-minute snapshot of global investment opportunities.
Because prices do such a good job incorporating information about securities in every market, they also offer the best prediction of future prospects. No sensible story or compelling empirical research suggests investors can consistently outguess those prices and pick winning countries. A well-diversified, global portfolio can help capture the returns of markets around the world and deliver more reliable outcomes over time.
How to read the Checkerboard
The tables in Exhibit 1 illustrate 20 years of annual equity returns for developed and emerging markets. Each color represents a different country. Each column is sorted top-down, from the highest-performing country to the lowest.
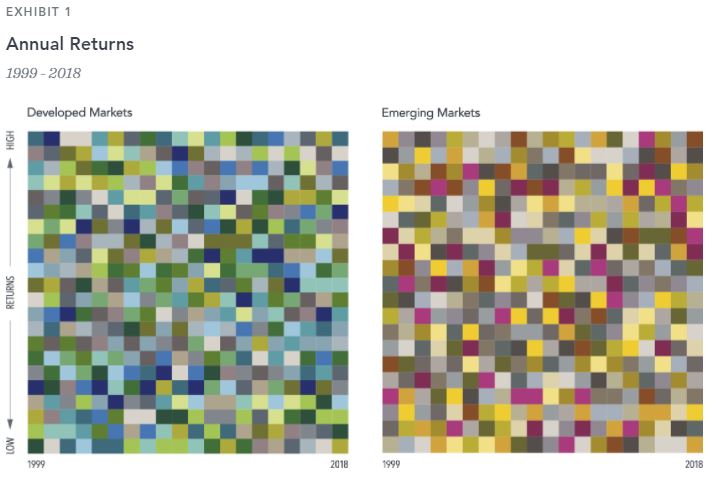
Taken together, these tables powerfully demonstrate the randomness of global equity returns. In either table, pick a colour in the first column and follow it through to the right. Does any country seem to follow a pattern that gives clues about its future performance?
Consider the performance of the US and Denmark, shown in Exhibit 2. Is it immediately clear which country had the higher return over the past two decades?
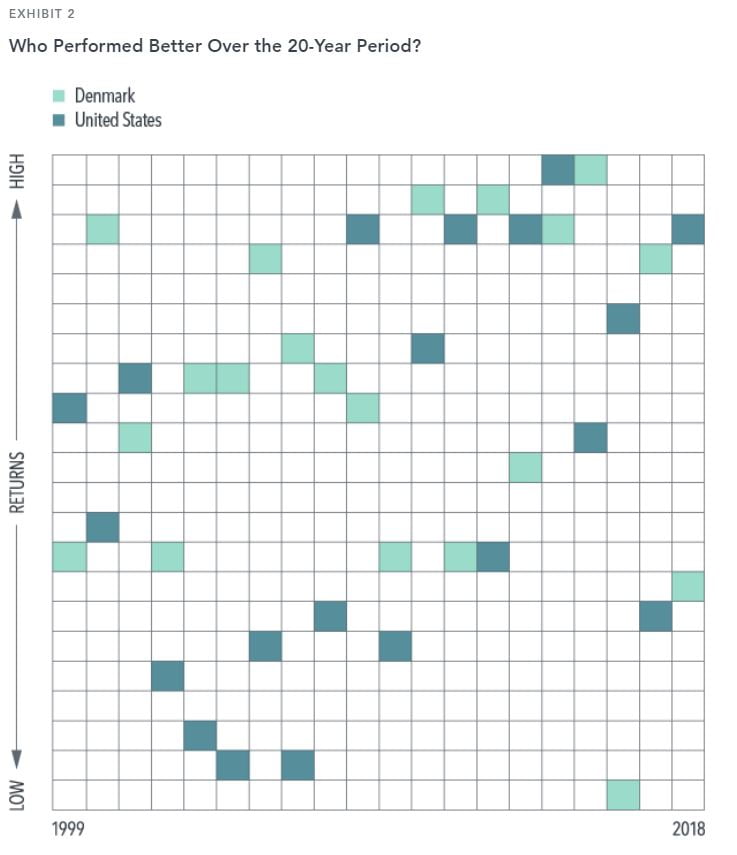
Denmark, in fact, was the best performer among all developed markets, with an annualised return of 8.4%. Surprisingly perhaps, Denmark had the best calendar year return only once, in 2015. The US, despite some strong returns in the last several years, placed ninth overall with an annualised return of 4.2%. Bear in mind, Denmark represents less than 1% of the global market cap available to investors.
From First to Worst
Denmark also provides an example of the unpredictability in short-term results. After posting the highest developed market return in 2015, Denmark had the lowest return in 2016. Countries have also moved in the opposite direction, from worst to first, in consecutive years. In 2000, New Zealand had the lowest return among developed markets followed by the highest return in both 2001 and 2002. In emerging markets, Hungary and Russia went from the bottom two performers in 2014 to the top two performers in 2015.
Going to Extremes
In a single year, the difference between the return of the highest-performing country and the lowest can be dramatic, as shown in Exhibit 3. Among developed markets over the last 20 years, the difference between the best and worst performers has ranged from a low of 26% in 2018 to as much as 63% in 2004. The differences in emerging markets are even more pronounced, ranging from 46% in 2013 to 171% in 2005. In fact, the difference in emerging markets has exceeded 100% in several years.
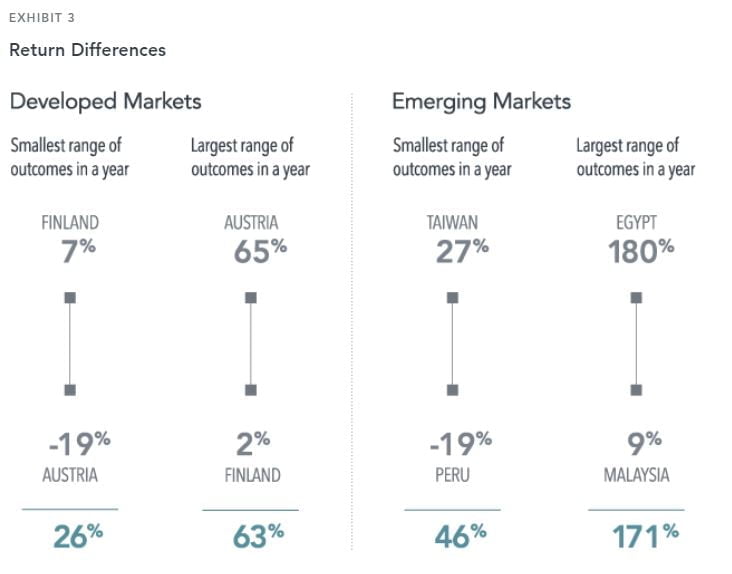
These extreme differences in outcomes, combined with the examples of countries that experienced sharp reversals in their return rankings, highlight the risk of trying to predict future returns by looking at the past and emphasise the importance of diversification across countries.
Now, the Good News
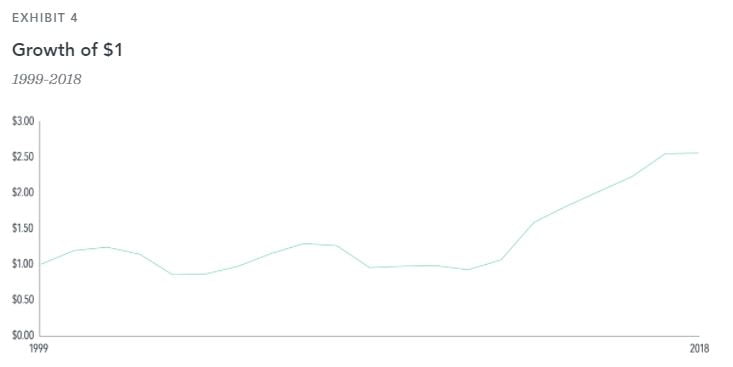
This evidence of the randomness in global equity returns, though, is not bad news for investors. Rather than trying to guess which country is going to outperform when, investors committed to a well-structured, globally diversified portfolio are better positioned to capture the performance of the global markets, where and when it occurs.
Over the last 20 years, every dollar invested in a globally diversified strategy, shown by the Dimensional Global Market Index in Exhibit 4, more than doubled.
A globally diversified approach can deliver more reliable outcomes over time with less volatility than investing in individual countries. This can help investors stay on track, through all kinds of markets, toward their long-term goals.
Learn More
While a diversified market portfolio can be a good strategy for many investors, Dimensional believes it is possible to achieve higher returns than the market without having to outguess it. By using the market as a starting point and adding value through robust daily processes, Dimensional seeks to minimise risk and increase the likelihood of a good outcome.
If you would like to know about how we can help you get better long-term investment outcomes, give us a call on (03) 5331 6550.
Courtesy Dimensional Fund Advisers (Australia)
FOOTNOTES
1Number of countries and publicly traded companies data provided by Bloomberg.
DISCLOSURES
AUSTRALIA and NEW ZEALAND: In Australia, this material is provided by DFA Australia Limited (AFSL 238093, ABN 46 065 937 671). It is provided for information only and is not intended for public use. No account has been taken of the objectives, financial situation or needs of any particular person. Accordingly, to the extent this material constitutes general financial product advice, investors should, before acting on the advice, consider the appropriateness of the advice, having regard to the investor’s objectives, financial situation and needs. Any opinions expressed in this publication reflect our judgment at the date of publication and are subject to change.
DIMENSIONAL GLOBAL MARKET INDEX
January 1990–present: Compiled by Dimensional from Bloomberg securities data. Market cap-weighted index of all securities in the eligible markets. The index monthly returns are computed as the simple average of the monthly returns of four sub-indices—each one reconstituted once a year at the end of each quarter of the year. Maximum index weight of any one company is capped at 5%. Countries: Australia, Austria, Belgium, Canada, Denmark, Finland, France, Germany, Hong Kong, Ireland, Israel, Italy, Japan, the Netherlands, New Zealand, Norway, Portugal, Singapore, Spain, Sweden, Switzerland, the UK, and the US. Exclusions: REITs and investment companies. The index has been retroactively calculated by Dimensional and did not exist prior to April 2008.
Exhibit 4 references the period 1999-2018, Dimensional has constructed this hypothetical index to cover an extended period prior to 1999, retroactively constructing to 1990.
There is no guarantee investment strategies will be successful. Investing involves risks, including possible loss of principal. Diversification does not eliminate the risk of market loss.
International investing involves special risks, such as currency fluctuation and political instability. Investing in emerging markets may accentuate these risks.