
[nectar_dropcap color=”#0071bc”]I [/nectar_dropcap]nflation in the US has surged to the highest level in nearly 40 years, reaching 7.9% in February 2022.1,2 This, coupled with the US Federal Reserve’s decision to raise interest rates, has alarmed many investors.3 Some are turning to dividend-paying stocks, hoping to receive more income protection and higher returns.4 Will it work?
KEY TAKEAWAYS
- With inflation at its highest level in decades and the US Federal Reserve raising interest rates, investors may be wondering whether they should devote more of their portfolios to dividend-paying stocks.
- There’s no strong evidence that dividend stocks have delivered superior inflation-adjusted performance during periods of high inflation or rising interest rates.
- Investors can put themselves in a better position to achieve their financial goals by staying disciplined, diversifying broadly, and considering strategies designed to outpace or hedge against inflation and rising rates.
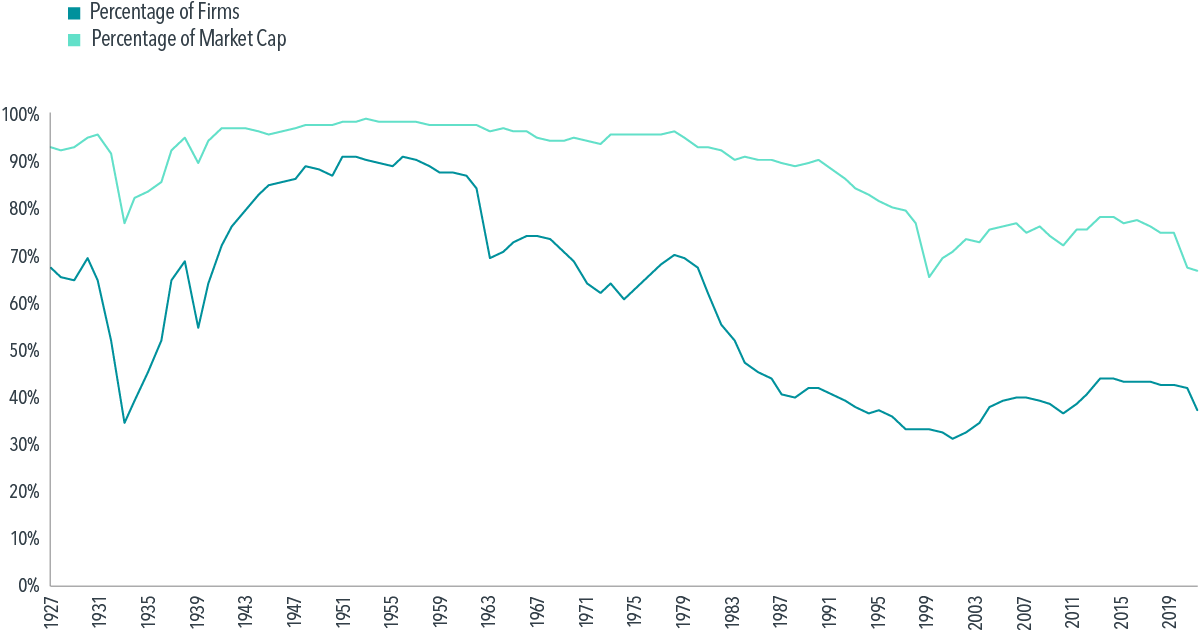
Before diving into the performance of dividend-paying stocks, it’s important to note that the percentage of firms paying dividends has declined globally.5 As shown in Exhibit 1, 68% of US companies were paying dividends in 1927, while only 38% of firms paid in 2021. By focusing only on dividend-paying stocks, we will be sacrificing diversification. In addition, a dividend-focused strategy does not necessarily provide stable income. In fact, changes in dividend policy are common, especially during times of higher uncertainty. For example, many dividend payers cut their dividends during the pandemic—in the first three quarters of 2020, dividends from each dollar invested in US markets decreased by 22% compared to the same period in 2019.6
EXHIBIT 1
Diversification Down
Annual percentage of firms and market cap that paid dividends in US, 1927-2021
Do Dividends Help Combat High Inflation?
To answer this question, we study the performance of Fama/French US portfolios formed on dividend yield from 1928 to 2021.7 At the end of each June, all US companies are divided into two groups, payers and nonpayers, based on whether they paid a dividend during the previous 12 months. Then, within the payers, high payers are defined as the 30% of firms with the highest dividend yields, and the low payers are the bottom 30%. As of December 2021, the weighted average dividend yield is 1.8%, 0.7%, and 3.7% for payers, low payers, and high payers, respectively.
Exhibit 2 shows that all four dividend portfolios had positive nominal and real average returns in high-inflation years, when inflation was on average 5.5% per year.8,9 So outpacing high inflation over the long term is not a unique advantage of dividend-paying stocks. In addition, the return differences between payers vs. nonpayers and high payers vs. low payers are not reliably different from zero. Therefore, we don’t see strong evidence that dividend-paying stocks deliver superior inflation-adjusted performance during high inflation periods.
EXHIBIT 2
No Special Delivery
Average annual returns of dividend portfolios in high-inflation years, 1928-2021
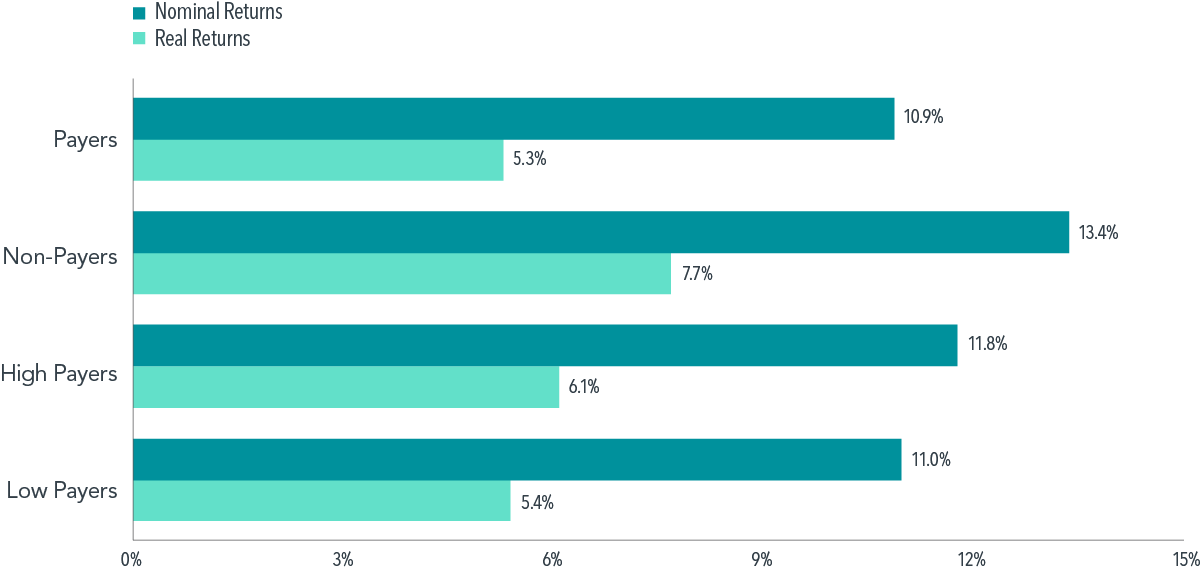
Past performance is no guarantee of future results.
In Exhibit 3, we take a closer look at inflation and the relative performance of dividend-paying stocks each year. The scatterplot charts reveal no clear pattern between the level of inflation and the difference in performance between payers and nonpayers (Panel A) or between high payers and low payers (Panel B) in the same year. The lack of relation is also apparent when we look at the performance of dividend portfolios against contemporaneous changes in annual inflation in Exhibit 4. These results suggest that even a crystal ball on annual inflation levels or inflation changes tells us little about how dividend-paying stocks would fare. As a result, chasing dividends during, or in anticipation of, high inflation periods may be unlikely to lead to better investment outcomes.
EXHIBIT 3
Scattershot
Inflation level and relative performance of dividend portfolios in same year, 1928-2021
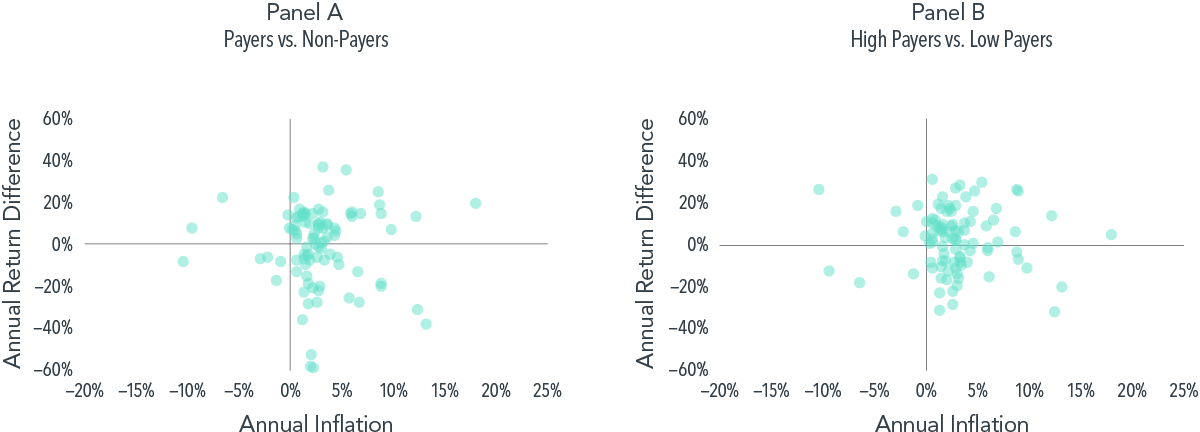
Past performance is no guarantee of future results.
EXHIBIT 4
Fuzzy Relation
Change in annual inflation and relative performance of dividend portfolios in same year, 1928-2021
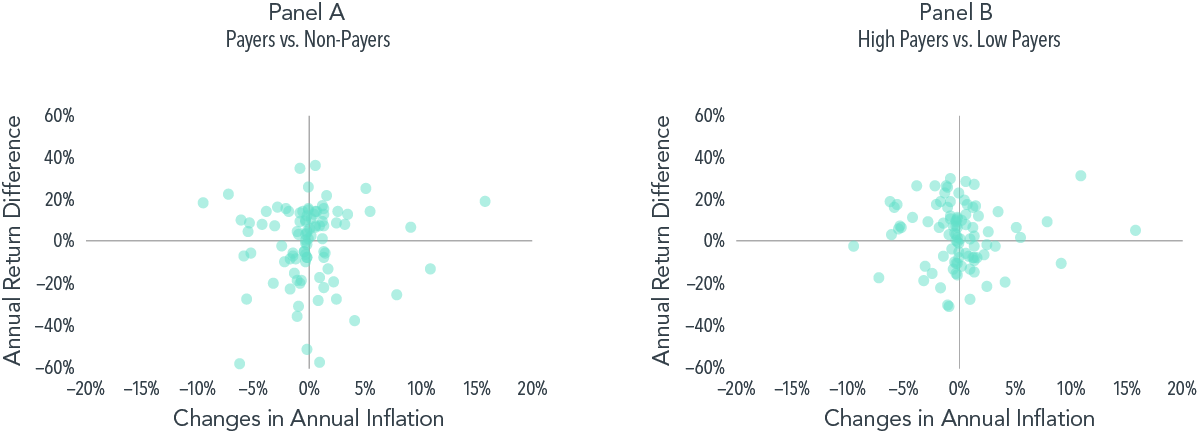
Past performance is no guarantee of future results.
What about Rising Interest Rates?
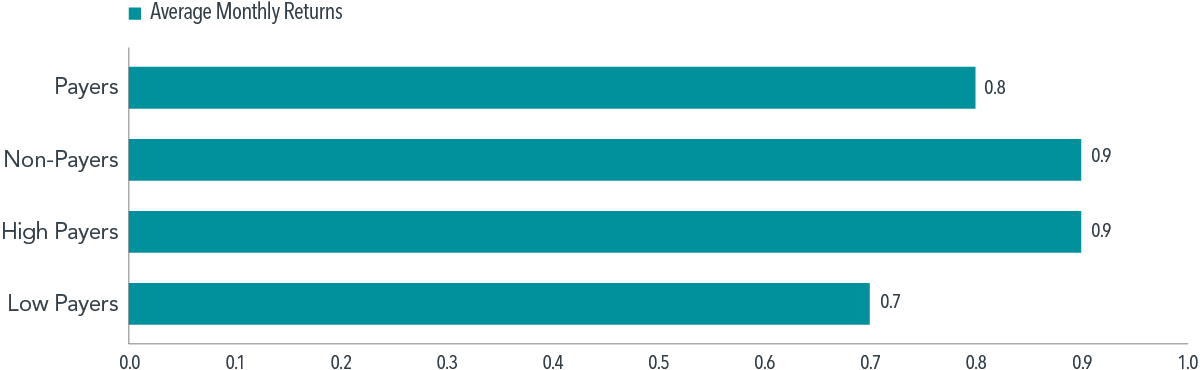
We first look at the average monthly returns for different dividend portfolios in months with rising 3-month Treasury yields. Exhibit 5 shows that dividend payers, nonpayers, high payers, and lower payers had similar average monthly returns from March 1934 to December 2021. The conclusions are similar using the effective federal funds rate and 10-Year Treasury yields.10 Piling into dividend stocks would not have led to superior returns in months with rising interest rates.
EXHIBIT 5
Unconvincing
Average monthly returns of dividend portfolios in months with rising 3-month Treasury yields, March 1934-December 2021
Past performance is no guarantee of future results.
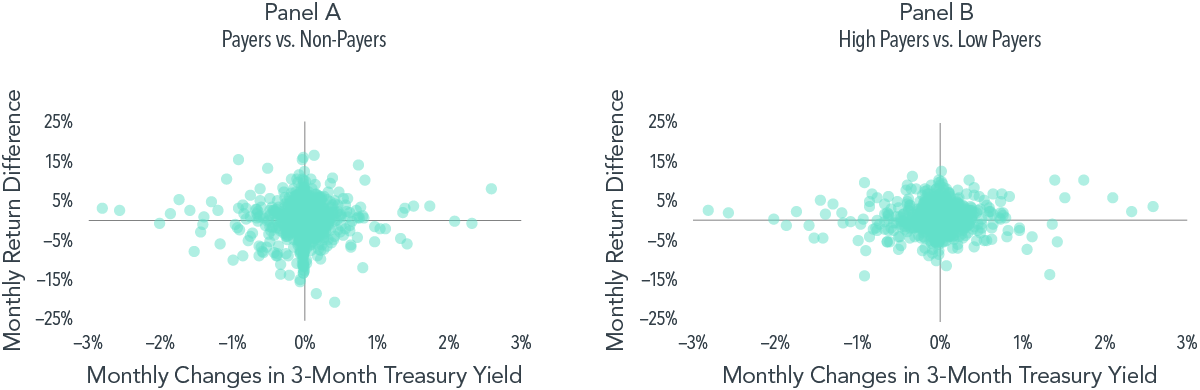
Changes in interest rates are largely unpredictable, even with Fed signals.11 Still, we ask what perfect foresight on interest rate changes each month can do for investors. The answer is not much. There is no discernable relationship between interest rate movements and the relative performance of dividend payers over nonpayers or high payers over low payers in the same month, as shown in Exhibit 6. Again, the results are similar when we use other interest rates, such as the effective federal funds rate and 10-Year Treasury yields.
EXHIBIT 6
Lumped Together
Monthly changes in 3-month Treasury yields and relative performance of dividend portfolios in same month, March 1934-December 2021
Past performance is no guarantee of future results.
What Should Investors Do?
It is natural to be concerned about the potential impact of high inflation and rising interest rates on portfolios. However, we believe our analysis shows there is no reason to expect dividend-paying stocks or high dividend payers to offer more protection and higher returns during these periods. Market prices reflect the aggregate expectations of all market participants, including expectations about inflation and interest rates. Staying disciplined and broadly diversified, instead of chasing dividend stocks, may put investors in a better position to achieve their investment goals.
INDEX DESCRIPTION
Fama/French Portfolios Formed on Dividend Yield
Provided by Fama/French from CRSP and COMPUSTAT data. Includes all NYSE, AMEX, and NASDAQ stocks for which we have market equity for June of year t, and at least 7 monthly returns (to compute the dividend yield) from July of t-1 to June of t. Portfolios are formed on D/P at the end of each June using NYSE breakpoints. The dividend yield used to form portfolios in June of year t is the total dividends paid from July of t-1 to June of t per dollar of equity in June of t.
Indices are not available for direct investment. Returns are in USD.
FOOTNOTES
1“Consumer Price Index – February 2022,” Bureau of Labor Statistics, US Department of Labor, March 10, 2022.
2US inflation is measured as the annual rate of change in the Consumer Price Index for All Urban Consumers (CPI-U, not seasonally adjusted) from the Bureau of Labor Statistics.
3Nick Timiraos, “Fed Raises Interest Rates for First Time Since 2018,” Wall Street Journal, March 17, 2022.
4Hardika Singh and Michael Wursthorn, “Investors Gobble Up Dividend Stocks During Market Turbulence,” Wall Street Journal, February 8, 2022.
5Stanley Black, “Global Dividend-Paying Stocks: A Recent History” (white paper, Dimensional Fund Advisors, March 2013).
6“Dividends in the Time of COVID-19,” Insights (blog), Dimensional Fund Advisors, November 30, 2020.
7See the Index Description for more information regarding Fama/French Portfolios formed on Dividend Yield.
8High-inflation years are defined as having inflation greater than the full sample median, 2.68%, from 1928 to 2021.
9Real returns are calculated using the following method: [(1 + nominal annual return) / (1 + inflation rate)] – 1.
10“Federal Funds Effective Rate (FEDFUNDS),” Federal Reserve Bank of St. Louis (Percent, Monthly, Not Seasonally Adjusted).
11Sooyeon Mirda, “Reading Fed Tea Leaves? Watch Market Prices Instead,” Insights (blog), Dimensional Fund Advisors, September 24, 2022.
DISCLOSURES
This material is in relation to the US market and contains analysis specific to the US.
Eugene Fama and Ken French are members of the Board of Directors of the general partner of, and provide consulting services to, Dimensional Fund Advisors LP.
The information in this material is intended for the recipient’s background information and use only. It is provided in good faith and without any warranty or representation as to accuracy or completeness. Information and opinions presented in this material have been obtained or derived from sources believed by Dimensional to be reliable and Dimensional has reasonable grounds to believe that all factual information herein is true as at the date of this material. It does not constitute investment advice, recommendation, or an offer of any services or products for sale and is not intended to provide a sufficient basis on which to make an investment decision. It is the responsibility of any persons wishing to make a purchase to inform themselves of and observe all applicable laws and regulations. Unauthorised reproduction or transmitting of this material is strictly prohibited. Dimensional accepts no responsibility for loss arising from the use of the information contained herein.
“Dimensional” refers to the Dimensional separate but affiliated entities generally, rather than to one particular entity. These entities are Dimensional Fund Advisors LP, Dimensional Fund Advisors Ltd., Dimensional Ireland Limited, DFA Australia Limited, Dimensional Fund Advisors Canada ULC, Dimensional Fund Advisors Pte. Ltd, Dimensional Japan Ltd. and Dimensional Hong Kong Limited. Dimensional Hong Kong Limited is licensed by the Securities and Futures Commission to conduct Type 1 (dealing in securities) regulated activities only and does not provide asset management services.
Risks Investments involve risks. The investment return and principal value of an investment may fluctuate so that an investor’s shares, when redeemed, may be worth more or less than their original value. Past performance is not a guarantee of future results. There is no guarantee strategies will be successful.
AUSTRALIA and NEW ZEALAND
This material is issued by DFA Australia Limited (AFS License No. 238093, ABN 46 065 937 671). This material is provided for information only. No account has been taken of the objectives, financial situation or needs of any particular person. Accordingly, to the extent this material constitutes general financial product advice, investors should, before acting on the advice, consider the appropriateness of the advice, having regard to the investor’s objectives, financial situation and needs. Investors should also consider the Product Disclosure Statement (PDS) and the target market determination (TMD) that has been made for each financial product either issued or distributed by DFA Australia Limited prior to acquiring or continuing to hold any investment. Go to au.dimensional.com/funds to access a copy of the PDS or the relevant TMD. Any opinions expressed in this material reflect our judgement at the date of publication and are subject to change.
This blog article was written by Mia Huang, CFA, Senior Associate, Research, published in the website: https://www.dimensional.com/au-en/insights/should-you-chase-dividend-stocks-to-combat-inflation-and-rate-hikes on Apr 05, 2022.
If you would like to chat about how this might impact your financial goals, please call me on 5331 6550 or email andrew@arwm.com.au
Cheers, Andrew